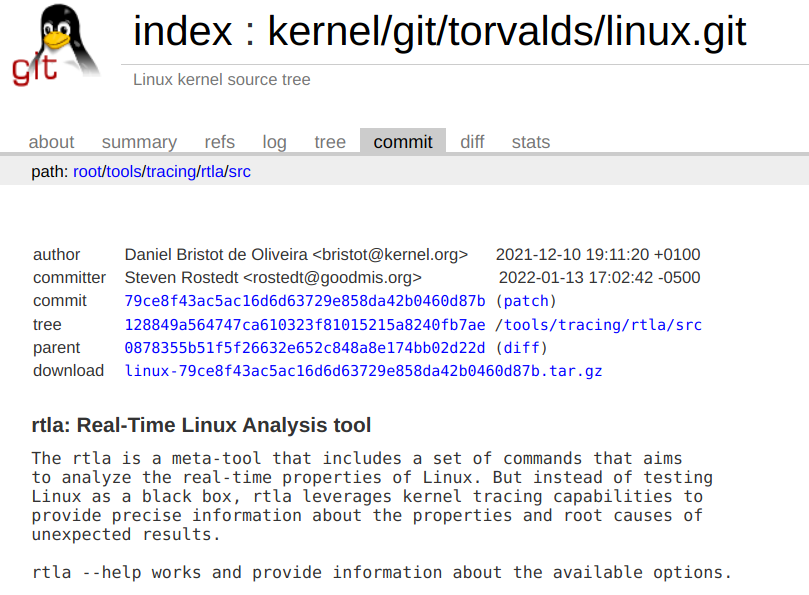
RTLA starts as the user-space interface for the timerlat and osnoise tracers, presenting an intuitive interface to use and process data. It transforms these tracers into a benchmark-like tool, aided by tracing.

RTLA makes it easier for users and developers to collect performance and trace data, helping fine-tune their systems/algorithms.
It is also helpful for those kernel developers that are not familiar with the debugging of the PREEMPT_RT but will have to evaluate their changes with this config on as it will soon land in the mainline tree.
For example, running:
# rtla timerlat top -P f:95 -T 150 -t trace_output.txt
The user can get a summary of the latency experienced by a high priority task (-P f:95), and in the case of a latency higher than 150 us (-T 150), the trace with debug information will be saved in the trace_output.txt. This trace is a good starting point for a kernel-rt developer to find the root cause of the problem.
But there are more to come, like the real-time Linux scheduling analysis tool (which will be fundamental for safety-critical systems) and other tools to evaluate the properties of the real-time features/schedulers of the penguin. It is just starting!