Welcome to the companion page of the paper Demystifying the Real-Time Linux Scheduling Latency, from Daniel Bristot de Oliveira, Daniel Casini, Rômulo Silva de Oliveira, and Tommaso Cucinotta. This published at the 32nd Euromicro Conference on Real-Time Systems (ECRTS 2020)
The paper is available here, and the slides are here. The [updated] source code is here.
Introduction
Real-time Linux has been a recurring topic in both research and industry for more than a decade. Nowadays, Linux has an extensive set of real-time related features, from theoretically-supported schedulers such as SCHED_DEADLINE to the priority inversion control in locking algorithms and a fully preemptive mode. Regarding the fully preemptive mode, Linux developers have extensively reworked the Linux kernel to reduce the code sections that could delay the scheduling of the highest-priority thread, leading to the well-known PREEMPT_RT variant. Cyclictest is the primary tool adopted in the evaluation of the fully-preemptive mode of PREEMPT_RT Linux, and it is used to compute the time difference between the expected activation time and the actual start of execution of a high-priority thread running on a CPU. By configuring the measurement thread with the highest priority and running a background task set to generate disturbance, cyclictest is used in practice to measure the scheduling latency of each CPU of the system. Maximum observed latency values generally range from a few microseconds on single-CPU systems to 250 microseconds on non-uniform memory access systems, which are acceptable values for a vast range of applications with sub-millisecond timing precision requirements. This way, PREEMPT_RT Linux closely fulfills theoretical fully-preemptive system assumptions that consider atomic scheduling operations with negligible overheads.
Despite its practical approach and the contributions to the current state-of-art of real-time Linux, cyclictest has some known limitations. The main one arises from the opaque nature of the latency value provided by cyclictest. Indeed, it only informs about the latency value, without providing insights on its root causes. The tracing features of the kernel are often applied by developers to help in the investigation. However, the usage of tracing is not enough to resolve the problem: the tracing overhead can easily mask the real sources of latency, and the excessive amount of data often drives the developer to conjunctures that are not the actual cause of the problem. For these reasons, the debug of a latency spike on Linux generally takes a reasonable amount of hours of very specialized resources.
A common approach in the real-time systems theory is the categorization of a system as a set of independent variables and equations that describe its integrated timing behavior. However, the complexity of the execution contexts and fine-grained synchronization of the PREEMPT_RT make application of classical real-time analysis for Linux difficult. Linux kernel complexity is undoubtedly a barrier for both expert operating system developers and real-time systems researchers. The absence of a theoretically-sound definition of the Linux behavior is widely known, and it inhibits the application of the rich arsenal of already existing techniques from the real-time theory. Also, it inhibits the development of theoretically-sound analysis that fits all the peculiarities of the Linux task model.
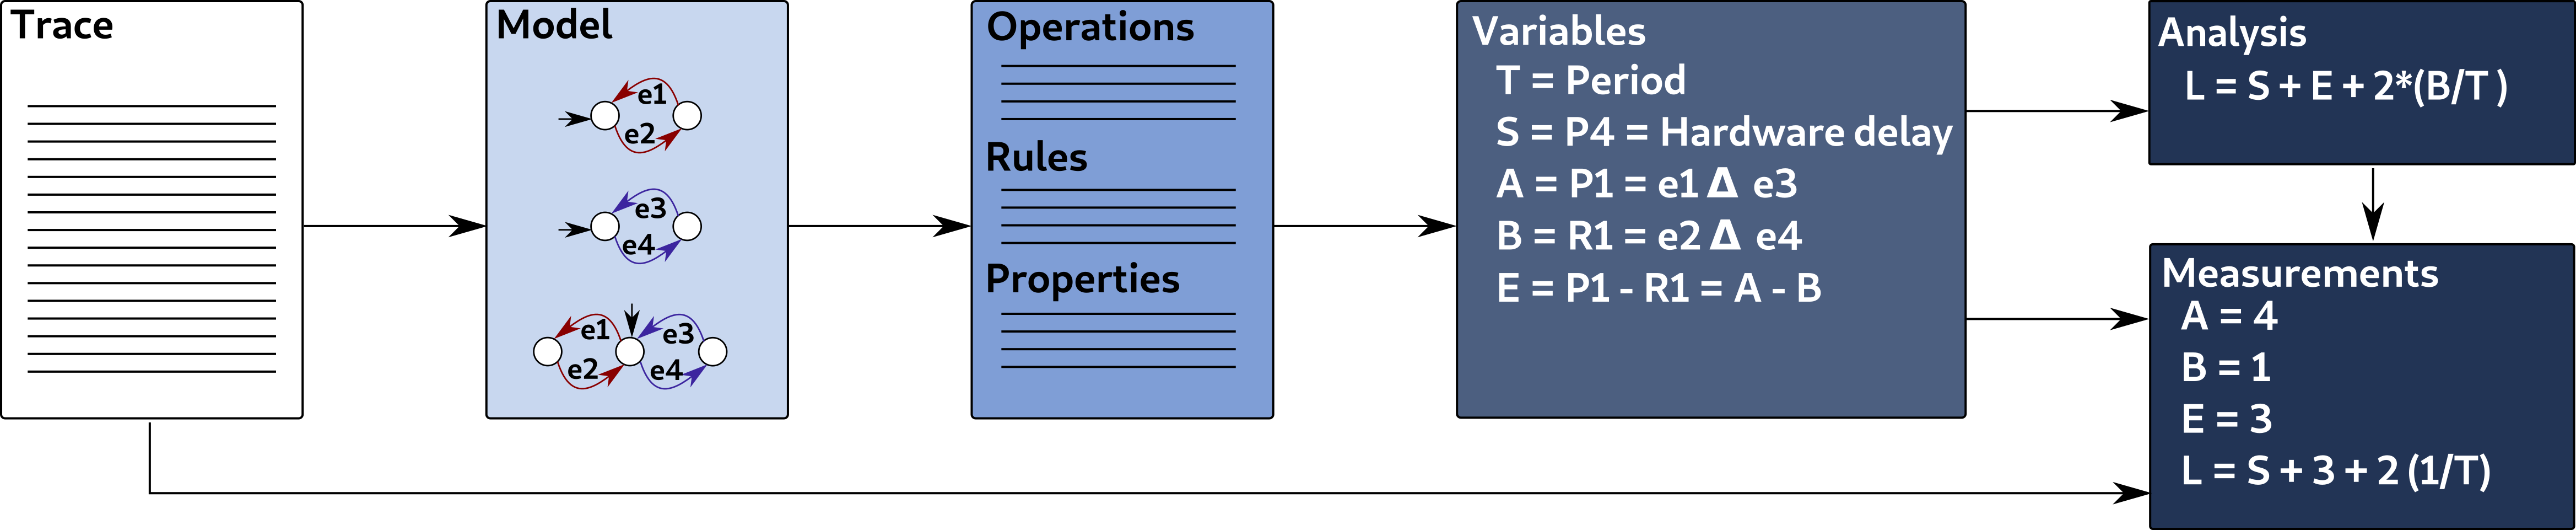
Aware of the situation, researchers and developers have been working together in the creation of models that explain the Linux behavior using a formal notation, abstracting the code complexity. The Thread Synchronization Model for the fully-preemptive PREEMPT RT Linux Kernel proposes an automata-based model to explain the synchronization dynamics for the de facto standard for real-time Linux. Among other things, the model can be used as an abstraction layer to translate the kernel dynamics as analyzed by real-time Linux kernel developers to the abstractions used in the real-time scheduling theory.
Paper approach and contributions:
The paper leverages the Thread Synchronization Model of Linux to derive a set of properties and rules defining the Linux kernel behavior from a scheduling perspective. These properties are then leveraged in an analysis that derives a theoretically-sound bound to the scheduling latency that comprehensively considers the sources of delays, including all possible synchronization flows in the kernel code. The analysis builds upon a set of practically-relevant modeling variables inspired by the foundational principles behind the development of the PREEMPT_RT Linux Kernel. The paper also presents an efficient tracing method to observe the kernel events, that are used to define observed values for the variables used in the analysis, while keeping the runtime overhead and storage space to figures that make its use feasible in practice. The tool also analyzes the trace, serving to distinguish the various sources of the latency. Moreover, by exploring the interference caused by adopting different interrupt characterizations, the tool also derives latency bounds based on real execution traces. Finally, the experimental section compares the results obtained by the cyclictest and the proposed tool, showing that the proposed method can find sound bounds faster with acceptable overheads.
rt scheduling latency bound
The most important contribution of this paper is the scheduling latency bound. The formal definition of the bound is presented in the paper. But, in words, the scheduling latency is divided into two main parts: the blocking and the interference.
Blocking
In the real-time literature, blocking means that a higher priority task is blocked by a lower priority task. In the context of this paper, the blocking can be cause by the lower priority thread that is currently running.
The blocking (or interference-free latency in the paper) is defined in Lemma 7 as:
LIF ≤ max(DST, DPOID) + DPAIE + DPSD
Where:
- L means the scheduling latency;
- IF Interference-free;
- D means the delay of:
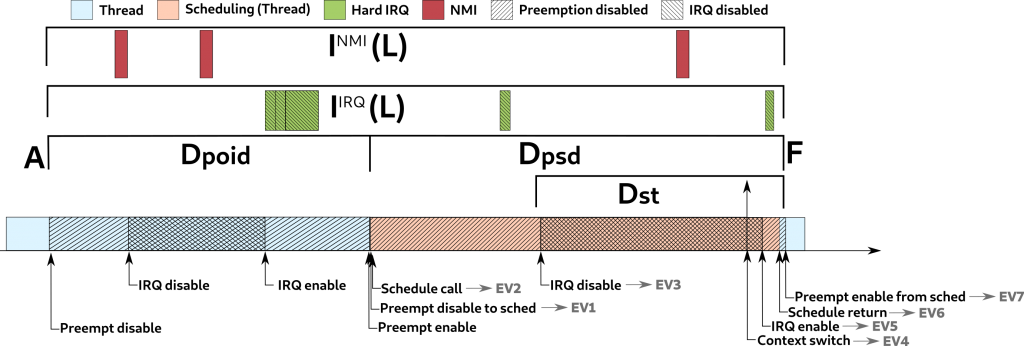
- ST: the sched tail delay which is the delay from the IRQs being disabled to cause the context switch, and the return from the scheduler.
- POID: the longest preemption or IRQ disabled to postpone the scheduler;
- PAIE: the longest time in which the preemption and IRQs are transiently enabled in the return of the preemption or IRQ enable, that will cause the scheduler execution to preempt the current thread.
- PSD: the longest time in which the preemption is disabled to execute __schedule() function.
In words, the real-time scheduling latency, not considering the interference, is bounded by:
- the maximum time window of either:
- the preemption or IRQ was disabled to postpone the scheduler (poid).
- This is trivial;
- the preemption and IRQ disabled to finish the context switch of the previous task (dst).
- This is not that trivial, but imagine that the scheduler is running with interrupts already disabled to cause the context switch, delaying the IRQ that will wakeup the highest priority thread. See Lemma Lemma 4 for a complete explanation.
- the preemption or IRQ was disabled to postpone the scheduler (poid).
- plus:
- the transient time window in which both interrupts and IRQs are enabled, and the system is checking if it needs resched (see schedule() function) (paie).
- plus:
- the time window in which the preemption is disabled to call the scheduler (psd).
These delays are better illustrated in Figure 1.
Interference
In addition to the blocking from a lower priority thread, the scheduling latency also suffers the interference from interrupts (i.e., IRQ and NMIs). In the academic vocabulary, interference means that a task execution is being influenced by a higher priority task.
The problem with the IRQs and NMI interference is that there is no single way to characterize them. Indeed, this was the main problem raised during the discussion we had at the real-time micro-conference at the Linux Plumbers 2019. So, instead of choosing a single characterization, we decided to try some well-known characterization. They are:
- No Interrupts:
- It is the latency of the system if there was no interrupt:
- Personal opinion: optimistic case, it is the baseline.
- Single interrupt: just one (the worst) interrupt taking place:
- Personal opinion: optimistic case, but illustrative.
- All interrupts taking place a single time:
- Personal opinion: is an optimistic case because it only counts one interrupt of each (easy to justify its real occurrence). Still, often this value is already higher than typical cyclictest ones, showing that cyclictest can hardly catch such optimistic cases.).
- Sporadic:
- The longest execution and the shortest delta between two consecutive execution of a given IRQ are used as the execution time and period in the Response-time Analysis.
- Personal opinion: it is not realistic to think about IRQs as simple periodic tasks. Indeed, they look more like aperiodic tasks. As an effect, the results are overly pessimistic. Indeed, in the vast majority of the times, the period is smaller than the execution time, and so the method says that the latency is infinite. So why did I put it? Because it is important to illustrate that.
- Sliding window:
- The fact that IRQs are aperiodic motives the usage of the sliding window
- Giving a window of time; do
- for each IRQ vector
- for each IRQ occurrence,
- try to see how much time this IRQ occurrence can enlarge the window, and if the next interrupts of the same vector could also take place in this newly enlarged window.
- for each IRQ occurrence,
- for each IRQ vector
- Until the window stop to increase.
- Personal opinion: this is the case that fits better with the proposed approach, the values for the thread variables are observed values, and so it is far to use the worst observed sequence of each IRQs that actually happened. Assuming WCET for all occurrence seems to be unrealistic, but defining what is good or bad is not a goal of the paper, and that desires a lot of research.
- Sliding window with oWCET:
- It is the same Sliding Window algorithm, but assuming the oWCET for the given IRQs (and not the execution time of each interrupt).
- personal opinion: It is nice but too pessimistic. Still, the values are shown that even with this pessimism, the latency is under 5 or 10 ms, which is not bad for many workloads.
rtsl: scheduling measurement tool
Code
The PoC code is available here.
Overhead measurements
One important aspect of the tool is the low overhead added to the system while collecting data. Due to space constraints, the paper only mentions that the tool adds from two to four microseconds of overhead to the cyclictest results, without showing a comparison. To illustrate that, here we present a simple comparison.
In this comparison, we used the workstation system used in the paper, with the I/O intensive workload in the background, to conduce cyclictest measurements in four different scenarios:
- cyclictest only: baseline experiment;
- rtsl hooked without tracing: the latency parser hooked to the tracepoints, but without writing data to the trace buffer;
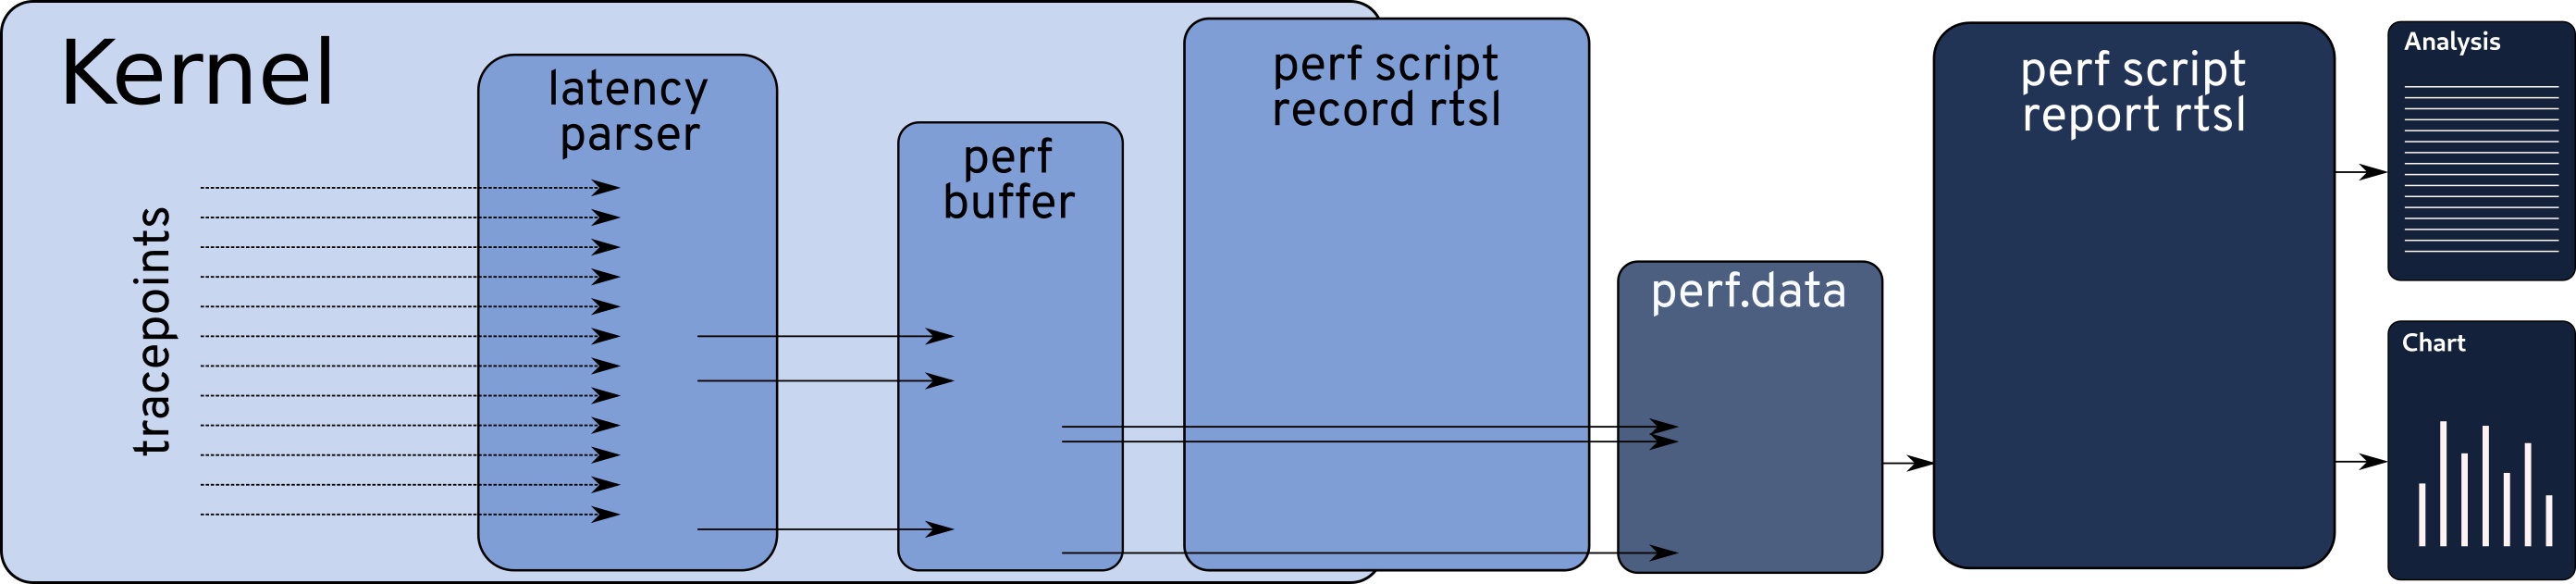
- rtsl hooked with perf tracing: tracing the rtsl variables using perf, as in the paper; and
- rtsl hooked with trace-cmd tracing: this is like the above experiment, but using trace-cmd to collect the data. trace-cmd is the user-space for ftrace, so it is in fact using ftrace instead of perf.
The experiments run for 30 minutes.
Cyclictest
This is the baseline experiment. It is cyclictest running without latency parser module load, neither tracing.
T: 0 ( 1812) P:99 I:1000 C:1800000 Min: 1 Act: 4 Avg: 3 Max: 21
T: 1 ( 1816) P:99 I:1500 C:1199998 Min: 1 Act: 4 Avg: 3 Max: 21
T: 2 ( 1822) P:99 I:2000 C: 899997 Min: 1 Act: 3 Avg: 2 Max: 17
T: 3 ( 1824) P:99 I:2500 C: 719997 Min: 1 Act: 4 Avg: 3 Max: 18
T: 4 ( 1826) P:99 I:3000 C: 599996 Min: 1 Act: 4 Avg: 3 Max: 18
T: 5 ( 1831) P:99 I:3500 C: 514282 Min: 1 Act: 4 Avg: 3 Max: 18
T: 6 ( 1832) P:99 I:4000 C: 449996 Min: 1 Act: 4 Avg: 4 Max: 20
T: 7 ( 1833) P:99 I:4500 C: 399996 Min: 1 Act: 5 Avg: 3 Max: 18
The average average latency (Avg) is 3 us and the average maximum latency (Max) is 18.875 us, with the Max latency on 21 us.
Cyclictest with the rtsl module hooked, but without recording trace
This run measures the overhead added by the tracepoint jump, tracepoint execution, and the rtsl computation of the values, but without writing the trace to the tracing buffers.
T: 0 (1159267) P:99 I:1000 C:1800000 Min: 1 Act: 2 Avg: 4 Max: 19
T: 1 (1159268) P:99 I:1500 C:1199993 Min: 2 Act: 3 Avg: 4 Max: 19
T: 2 (1159269) P:99 I:2000 C: 899990 Min: 2 Act: 5 Avg: 4 Max: 19
T: 3 (1159270) P:99 I:2500 C: 719988 Min: 1 Act: 3 Avg: 4 Max: 20
T: 4 (1159271) P:99 I:3000 C: 599987 Min: 2 Act: 3 Avg: 4 Max: 19
T: 5 (1159272) P:99 I:3500 C: 514272 Min: 2 Act: 4 Avg: 4 Max: 19
T: 6 (1159273) P:99 I:4000 C: 449985 Min: 2 Act: 5 Avg: 4 Max: 19
T: 7 (1159274) P:99 I:4500 C: 399985 Min: 2 Act: 3 Avg: 5 Max: 21
The average average latency (Avg) is 4.125 us and the average maximum latency (Max) is 19.375 us, with the Max latency on 21 us. So, the average latency raises by 1.125 us, while the average maximum raises on a 0.5 us, with the same maximum latency.
Cyclictest with rtsl module and perf recording trace
This is the case we show in the paper, where cyclictest run while collecting the trace with perf.
T: 0 (1977929) P:99 I:1000 C:1800000 Min: 2 Act: 5 Avg: 5 Max: 23
T: 1 (1977930) P:99 I:1500 C:1199994 Min: 2 Act: 6 Avg: 5 Max: 20
T: 2 (1977931) P:99 I:2000 C: 899991 Min: 2 Act: 5 Avg: 5 Max: 20
T: 3 (1977932) P:99 I:2500 C: 719989 Min: 2 Act: 7 Avg: 5 Max: 21
T: 4 (1977933) P:99 I:3000 C: 599987 Min: 2 Act: 4 Avg: 4 Max: 18
T: 5 (1977934) P:99 I:3500 C: 514272 Min: 2 Act: 5 Avg: 5 Max: 21
T: 6 (1977935) P:99 I:4000 C: 449986 Min: 2 Act: 7 Avg: 5 Max: 20
T: 7 (1977936) P:99 I:4500 C: 399985 Min: 2 Act: 6 Avg: 5 Max: 23
The average average latency (Avg) is 4.875 us and the average maximum latency (Max) is 20.750 us, with the Max latency on 23 us. So, the average latency raises by 1.875 us, while the average maximum raises by 1.875 us, with the maximum latency raised by 2 us.
Cyclictest with rtsl module and trace-cmd recording trace
This setup was not presented in the paper, but it was also possible (and we make it work after the submission). It uses the same setup of the paper but using trace-cmd (ftrace) instead of perf to collect data.
T: 0 (2783360) P:99 I:1000 C:1800000 Min: 2 Act: 2 Avg: 5 Max: 20
T: 1 (2783361) P:99 I:1500 C:1199994 Min: 2 Act: 2 Avg: 5 Max: 20
T: 2 (2783362) P:99 I:2000 C: 899991 Min: 2 Act: 2 Avg: 5 Max: 22
T: 3 (2783367) P:99 I:2500 C: 719989 Min: 2 Act: 3 Avg: 5 Max: 23
T: 4 (2783369) P:99 I:3000 C: 599986 Min: 2 Act: 3 Avg: 4 Max: 18
T: 5 (2783371) P:99 I:3500 C: 514272 Min: 2 Act: 3 Avg: 5 Max: 22
T: 6 (2783372) P:99 I:4000 C: 449986 Min: 2 Act: 3 Avg: 5 Max: 20
T: 7 (2783373) P:99 I:4500 C: 399985 Min: 2 Act: 2 Avg: 6 Max: 22
The average average latency (Avg) is 5 us and the average maximum latency (Max) is 20.875 us, with the Max latency on 23 us. So, the average latency raises by 2 us, while the average maximum raises by 1.5 us, with the maximum latency raised by 2 us.
Remarks
Giving that the rtsl toolkit is analyzing all the events that could cause latencies, the overhead presented by the tool is indeed reasonable, not changing the order of latencies measured by cyclictest. It is worth mentioning that these values can increase as the CPU speed lowers down. For example, in the Server environment used in the paper, the maximum latency could be up to four us higher, and that is because of the base frequency of the server, which is 2.27GHz, against the 4.00GHz of the workstation.
FAQ
Why is the experimental section so small? More things could be added!
We had more experiments done, and explanations to provide. However, we decide to focus on the theoretical part of the analysis. The experimental part could (and will) be extended via other formats, like blog posts and open-source media. But there was no other place for us to discuss the theoretical part other than in a paper, and the ECRTS is the best place to present and discuss it. Hence, while cutting off parts of the document, which had 30 pages, we took the decision to prioritize the theoretical aspects.
Why not using ftrace?
As there is no single way to characterize the interference from the IRQ “taskset”, we decided to consider many different characterizations, including the sliding window. The sliding window requires the track of all interrupts occurrence, storing them for later analysis, based on the observation of other values. The amount of storage required for this can be larger than the system’s memory, and ftrace requires the data to be in memory (because it runs in the kernel space). That is why we decided to use perf. However, we have the tool working using trace-cmd which is the tool that enables using ftrace all from user-space.
How about the hardware things like idle states and SMIs?
This paper focuses on scheduling latency that is caused by the operating system synchronization, which is the main focus of the PREEMPT_RT developers. SMIs and idle state can also influence the latency observed by the cyclictest. In particular, SMIs can also affect the values of variables, and for this paper, we assumed that the system was not affected by SMIs or a Hypervisor. These points will be addressed in the journal extension of this paper.
Is this the end of cyclictest?
NO!
The rtsl tool kit is a specialized tool that better covers one aspect: the scheduling latency. The scheduling latency is the point of interest for developers while trying to improve Linux kernel by reducing the sections of code with preemption or interruptions disabled (e.g., POID), scheduling (e.g., PSD), reducing the interference code from interrupts and so on. Cyclictest measures these values as part of its metric, which we will call here as “cyclictest latency.” On one hand, cyclictest latency would hardly capture the worst observed scheduling latency values at the same time (and even it captures, it will not provide evidence it captured it). On the other hand, cyclictest captures other behaviors, such as the delay caused by idle states, that precedes the scheduling latency, and the delay caused by the stop-machine pseudo-scheduler, which is a class of task that runs with a priority higher than cyclictest can run. So, cyclictest is still useful to capture these cases. Also, it does not depend on any specific kernel to run.
In other words, rtsl is a specialized tool that measures the scheduling latency, from the kernel point of view, with better coverage, evidencing the sources of latency. To do so, it depends on a specific kernel configuration (PREEMPT_RT, with preempt irq tracepoints, assuming no external interference). In contrast, the cyclictest captures a broader set of behaviors, from the user-space viewpoint, for any kernel, with any priority… but it is a black-box test, without providing evidence of the numbers it reports.
So both tools are useful and can live together: cyclictest as a lightweight tool, used to point for potential problems, with rtsl as a specialized tool for scheduling latency, that collects data for more complex analysis, targeting mainly safety-critical usages of Linux.
Hey! Cyclictest is showing a latency higher than rtls!
That is possible, the reason is that the cyclictest captures other behaviors, such as the delay caused by idle states, that precedes the scheduling latency, and the delay caused by the stop-machine pseudo-scheduler, which is a class of task that runs with a priority higher than cyclictest can run. So, yes! Cyclictest can show higher “latency” values, but it is because of cyclictest nature.
It is very unlikely but: rtsl captures the kernel events that are traceable. A non-traceable preempt_disable and/or IRQ masking can cause delays that are not noticed by rtsl. These non-traceable usages are generally used on small sections, mainly in the trace subsystems itself, so they would hardly be the root cause. Still, they exist.
Why not eBPF?
At the time of the development of the tool, BPF was not enabled on the PREEMPT_RT. This problem, however, is close to an end, as the solution is on the way to be included in with the kernel 5.7 (for the reader from the future to know: the paper was based in the 5.4, which is the latest -rt kernel, and the kernel 5.6 is the current release). However, with the fix in place in the 5.4, it was possible to substitute the perf interface with a bcc python script. The development of the latency parser filter using eBPF is already taking place. More about it soon.
Artifact evaluation
The experiments presented in this paper passed through the artifact evaluation process, which analyses the reproducibility of the experiments by other researchers, being approved by two external reviewers from the ECRTS 2020 artifact evaluation committee. The artifact evaluation paper is available here, and the artifact evaluation system is here.